Read in English below.
Metriky
vpsAdmin a https://status.vpsf.cz poskytují metriky ve formátu pro monitorovací systém Prometheus. O původním návrhu už jsem tady psal, výsledné metriky se trochu liší, takže spíš koukejte na aktuální stav ve vpsAdminu.
Funguje to tak, že nejprve si ve vpsAdminu v Edit profile → Metrics access tokens vytvoříte nový přístupový token. vpsAdmin vám ukáže scrape URL, kterou přidáte do konfigurace Prometheuse, úplně stejně jako tam nejspíš máte node_exporter. Danou URL si můžete otevřít i v prohlížeči nebo v terminálu a podívat se, jaké metriky jsou k dispozici.
Najdete tam třeba informace o využití CPU, zabrané paměti a disku, load average, přenosy dat, počty zásahů OOM killera, ale taky třeba datum do kdy máte zaplacené členství. Jsou tam i statusy jednotlivých nodů a výpadky/odstávky. Statusy VPS se ve vpsAdminu aktualizují co dvě minuty, takže moc nemá cenu metriky stahovat častěji.
Pomocí Prometheuse můžete jednotlivé hodnoty sledovat v čase, popř. si vytvořit vlastní pravidla a zasílat si upozornění přes alertmanager. Export metrik ve formátu pro Prometheus jsme zvolili zejména proto, že jej sami používáme na monitorování naší infrastruktury. S jinými systémy zkušenost nemám, ale třeba v Zabbixu to prý taky jde použít.
Metriky najdete i na https://status.vpsf.cz, odkaz je v patičce.
Heatmapy
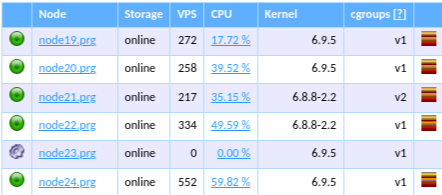
Na titulní stránce vpsAdminu se můžete podívat na zatížení jednotlivých nodů v reálném čase. V seznamu nodů klikněte na ikonku heatmapy vpravo:
Otevře se vám okno s aktuální zatížením CPU a disků:
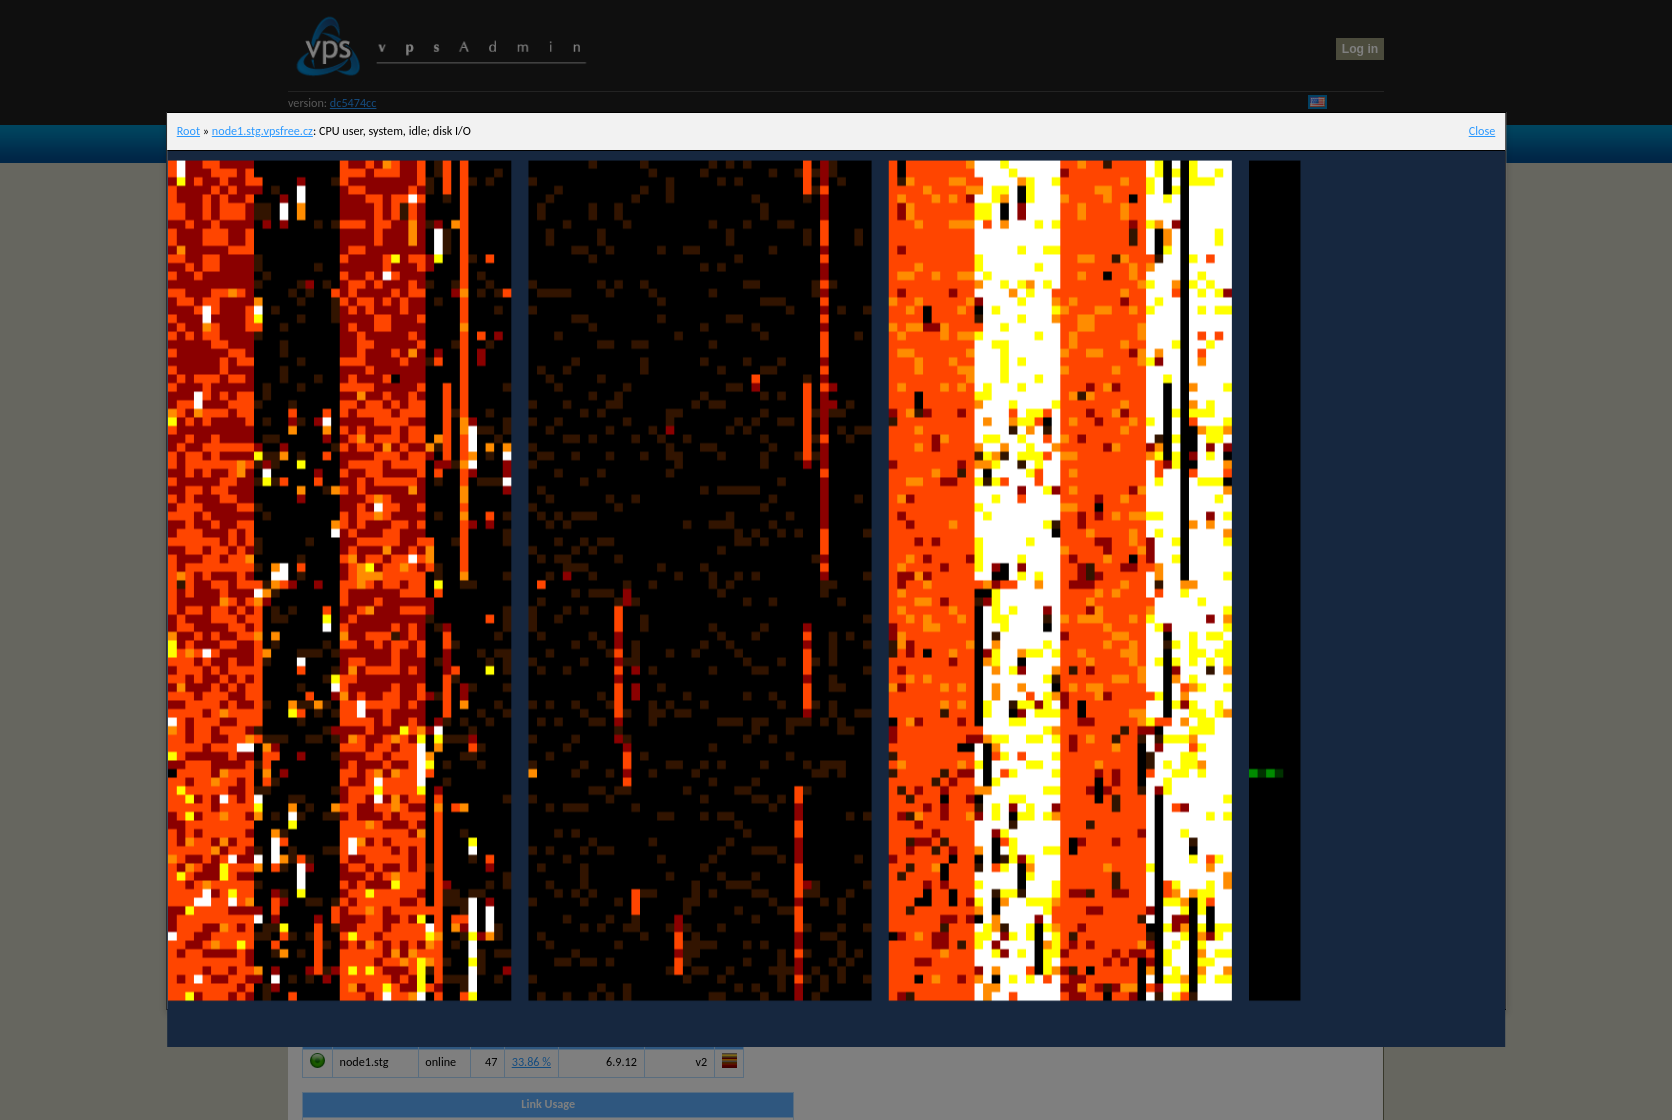
Jednotlivé sloupce zobrazují zleva CPU user, system, idle pro jednotlivé CPU a I/O disků. Každý řádek je jeden moment v čase pro všechny CPU a disky. Barvy jsou v rozsahu černá (zatížení 0 %) a bílá (zatížení 100 %). Bílá ve sloupcích user/system znamená plné vytížení, ve sloupci idle to ale naopak znamená, že má dané CPU volno. Okno zavřete buď kliknutím na Close vpravo nahoře, případně klikem kdekoli mimo okno.
Vykreslování heatmapy v prohlížeči je poměrně náročné na výkon CPU. Aplikace se to snaží detekovat a postupně upraví velikost heatmapy tak, aby fungovala plynule, tj. zkrátí se délka historie. Na větších nodech se 128/256 CPU se tedy může stát, že jako já uvidíte jen ~200px vysoký pruh, rychleji to holt nefunguje ![]()
Klikem do heatmapy se vykreslování pozastaví a shora se vypíšou popisky jednotlivých CPU a disků. Opětovným klikem se vykreslování zase spustí. Odkaz s názvem nodu v titulku okna otevře heatmapu přes celou obrazovku.
Když se vám tedy nebude něco zdát na výkonu VPS, můžete se rychle podívat, jak to na vašem nodu vypadá právě teď. Kdo si např. všimnete zvyšeného zatížení co 15s, tak to je synchronizace ZFS transakce (txg) na disky.
Koho by to zaujalo, zdrojové kódy najdete na GitHubu. Je to aplikace napsaná v Go, která ve výchozím stavu na portu 8080 pustí web server s heatmapou pro daný systém.
English
Metrics
vpsAdmin and https://status.vpsf.cz provide metrics in a format compatible with the monitoring system Prometheus. I have already written about the original proposal here, but the final metrics differ slightly, so it’s better to check the current state in vpsAdmin.
It works like this: first, create a new access token in vpsAdmin under Edit profile → Metrics access tokens. vpsAdmin will show you a scrape URL that you can add to your Prometheus configuration, similar to how you probably have node_exporter set up. You can also open this URL in your browser or terminal to see which metrics are available.
You’ll find information such as CPU usage, memory and disk usage, load average, data transfers, OOM killer hits, and even the date until your membership is paid. There are also statuses of individual nodes and outages/maintenance periods. VPS statuses in vpsAdmin are updated every two minutes, so there’s no point in fetching metrics more frequently.
Using Prometheus, you can track individual values over time, create your own rules, and send notifications via alertmanager. We chose to export metrics in a format for Prometheus primarily because we use it ourselves to monitor our infrastructure. I don’t have experience with other systems, but apparently, it can also be used in Zabbix as mentioned here.
You can also find the metrics on https://status.vpsf.cz, linked in the footer.
Heatmaps
On the home page of vpsAdmin, you can view the real-time load of individual nodes. In the node list, click on the heatmap icon on the right:
A window will open showing the current CPU and disk loads:
The columns show from left to right the CPU user, system, idle for each CPU, and disk I/O. Each row represents a moment in time for all CPUs and disks. The colors range from black (0% load) to white (100% load). White in the user/system columns means full load, while in the idle column, it means the CPU is free. Close the window by clicking Close in the top right corner or clicking anywhere outside the window.
Rendering the heatmap in the browser is quite CPU-intensive. The application tries to detect this and gradually adjusts the heatmap size to keep it running smoothly, i.e., the history length shortens. On larger nodes with 128/256 CPUs, you might only see a ~200px high strip; it just doesn’t work faster ![]()
Clicking on the heatmap pauses the rendering and displays labels for individual CPUs and disks at the top. Clicking again resumes the rendering. The link with the node name in the window title opens the heatmap in full screen.
If you notice any performance issues with your VPS, you can quickly check how your node is performing right now. You might notice increased load every 15 seconds, that’s the synchronization of ZFS transaction groups (txg) to disks.
For those interested, you can find the source code on GitHub. It’s an application written in Go that runs a web server by default on port 8080 with a heatmap for the given system.